x64 instrumentation profiler for Windows and linux
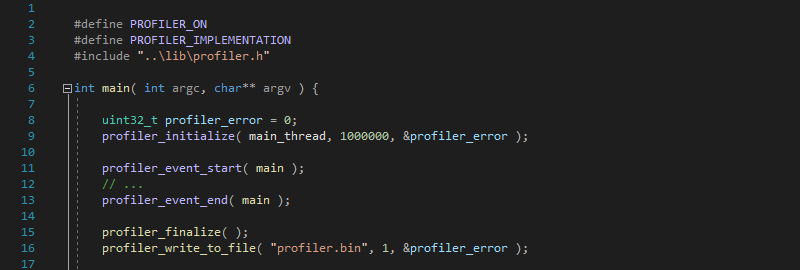
The profiler is a single C header (compatible with C++) providing lightweight functions to measure time between events; and functions to convert the recorded event streams into event trees for analysis. Events can be recorded in threads and the profiler can be disabled (with some care, e.g. not leaving open events) at run-time on a thread basis or all at once, and can easily be compiled out.
Event IDs need to be generated and included at compile time. An event ID generator is provided, that should be called as a pre-compile step but isn't required as long as you provide the necessary IDs.
A preview of a basic GUI is available to visualize recorded profiles.